v3.6Now on Android: Single Player mode · team profiles · sort by any statCheck it out
All help guides
The worm and Manhattan charts
Quick MatchFull Match
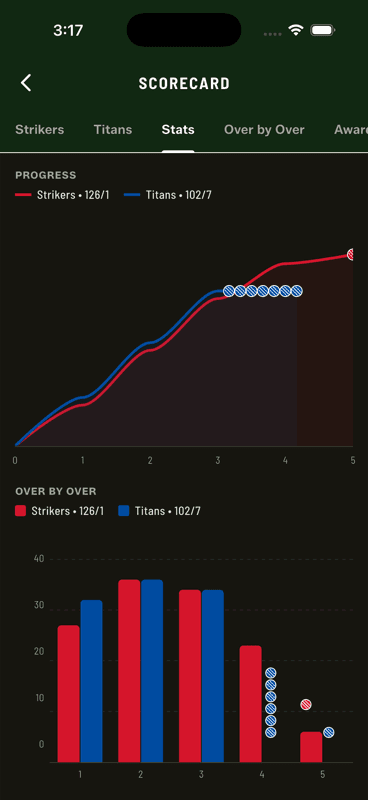
The Stats tab plots both innings together: a worm chart of cumulative runs so you can see where the chase was won or lost, and a Manhattan chart of runs per over. Wicket markers sit on both.
Both innings on the same axes — the gap is the match.
The worm
Cumulative runs against overs, with both teams overlaid. When one line pulls away from the other, that is the passage of play that decided the match — and the wicket markers usually explain why.
The Manhattan
Runs per over as bars, side by side. Good for spotting the over that changed everything, and for a bowler asking which of their overs actually went.
Both charts work in Quick Match too — they need only the score, not player names.
People also ask
What is a worm chart in cricket?
A line chart of cumulative runs against overs, with both innings overlaid. Where one line pulls away from the other is where the match was won.
What is a Manhattan chart in cricket?
A bar chart of runs scored in each over, named for its skyline shape. It shows which overs went for plenty and which were tight.